NEW DELHI:
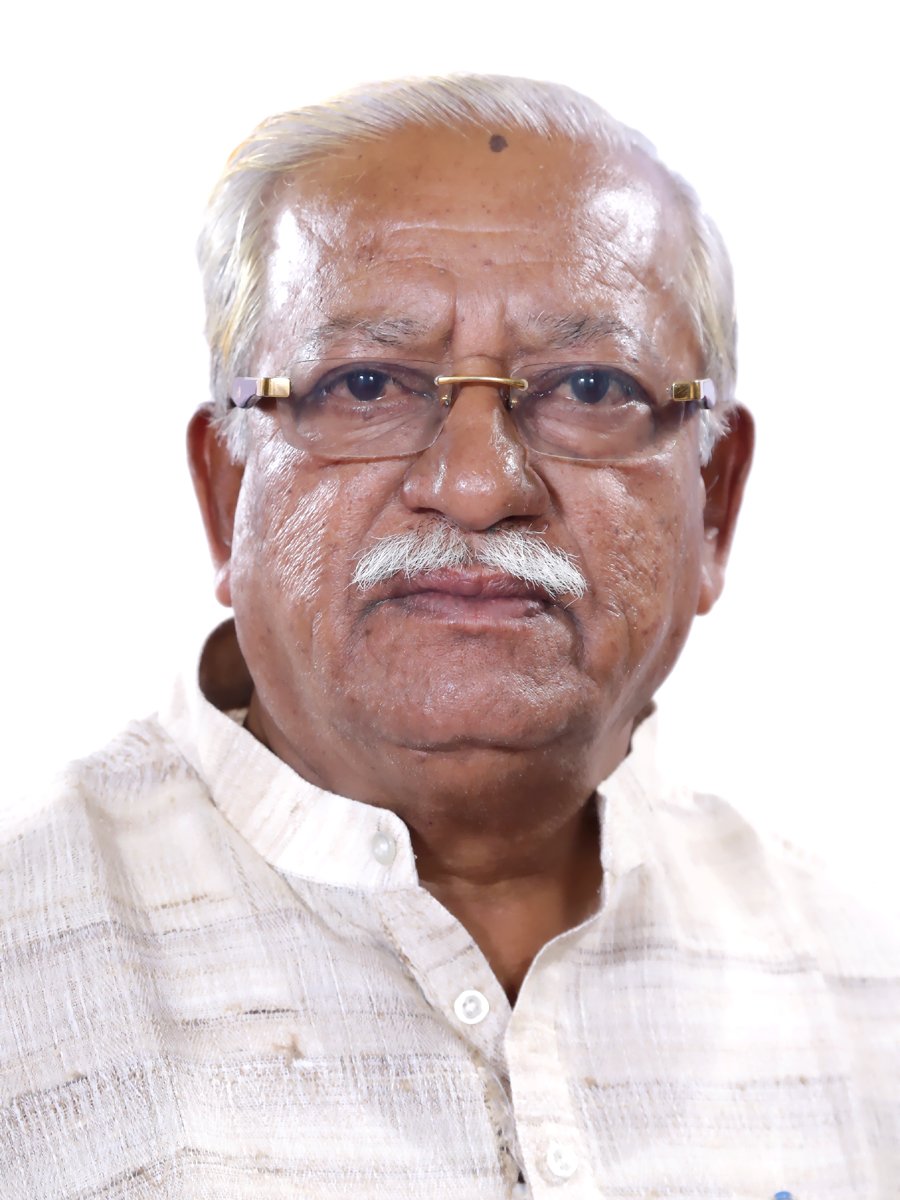
The assets of 71 MPs, who were re-elected to the Lok Sabha between 2009 and 2019, grew by a whopping 286 per cent on an average and the highest increase was recorded by the BJP’s Ramesh Chandappa Jigajinagi, according to a report released by the Association for Democratic Reforms (ADR) on Friday.

The total worth of Jigajinagi’s assets, which was about Rs 1.18 crore in 2009, went up to Rs 8.94 crore in 2014 and further to Rs 50.41 crore in 2019, registering an overall increase of 4,189 per cent, the report noted, referring to the self-sworn affidavits submitted by the Bharatiya Janata Party (BJP) leader during the Lok Sabha elections held in the respective years.
Re-elected to the Lower House of Parliament for a sixth consecutive term in 2019, the MP from Karnataka’s Bijapur served as the Union minister of state for drinking water and sanitation from July 2016 to May 2019 in the previous term of the government led by Prime Minister Narendra Modi.

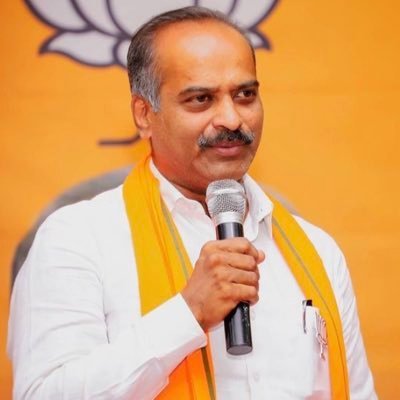
According to the report by ADR-National Election Watch, another BJP MP from Karnataka, PC Mohan, grabbed the second spot in the list of the top 10 members of Parliament who registered an increase in their assets between 2009 and 2019.
Mohan, who was re-elected to the Lok Sabha from the Bengaluru Central constituency in 2019, had declared assets worth about Rs 5.37 crore in the 2009 parliamentary polls. The figure climbed up to Rs 75.55 crore in 10 years, showing an increase of 1,306 per cent, the report noted.
The assets of BJP MP Varun Gandhi, who was re-elected from Uttar Pradesh’s Pilibhit for a third consecutive term in the last Lok Sabha election, rose from Rs 4.92 crore in 2009 to Rs 60.32 crore in 2019, the report noted.
According to the report, the assets of Harsimrat Kaur Badal, the Shiromani Akali Dal MP from Bhathinda, went up from Rs 60.31 crore in 2009 to Rs 217.99 crore in 2019, registering a rise of 261 per cent.
”Assets of Supriya Sadanand Sule of the NCP (Nationalist Congress Party) from the Baramati constituency (in Maharashtra) have increased by Rs 89.35 crore (173 per cent), from Rs 51.53 crore in 2009 to Rs 140.88 crore in 2019,” the report said.
The assets of Pinaki Misra, the Biju Janata Dal (BJD) MP from Puri in Odisha, climbed by 296 per cent (Rs 87.78 crore), from Rs 29.69 crore in 2009 to Rs 117.47 crore in 2019, the report added.
It noted that the average assets of the 71 MPs, including independents, was Rs 6.15 crore in 2009.
The report pegged the average growth in their assets from 2009 to 2019 at Rs 17.59 crore, an increase of 286 per cent. PTI
Summary of comparison for re-elected MPs
- Average Assets in 2009 Elections: The average assets of these 71 re-elected MPs fielded by various parties including independents in 2009 was Rs 6.15 Crores.
- Average Assets in 2014 Elections: The average asset of these 71 re-elected MPs in 2014 was Rs 16.23 Crores.
- Average Assets in 2019 Elections: The average asset of these 71 re-elected MPs in 2019 was Rs 23.75 Crores.
- Average Asset growth in 10 years (2009-2019):The average asset growth for these 71 re- elected MPs, between the Lok Sabha Elections of 2009 to 2019 is Rs 17.59 Crores.
- Percentage growth in 10 years (2009-2019):Average percentage growth in assets for these 71 re-elected MPs is 286%.
Top 10 Re-elected MPs with highest asset increase (Rupees- wise)
- Harsimrat Kaur Badal of SAD from Bhathinda constituency has declared maximum increase in assets with an increase of Rs 157.68 Crores i.e from Rs 60.31 Crores in 2009 to Rs. 217.99 Crores in 2019.
- Assets of Supriya Sadanand Sule of NCP from Baramati constituency have increased by Rs 89.35 Crores, from Rs 51.53 Crores in 2009 to Rs 140.88 Crores in 2019.
- Assets of Pinaki Misra of BJD from Puri constituency have risen by Rs 87.78 Crores, from Rs 29.69 Crores in 2009 to Rs 117.47 Crores in 2019.
| S.No. | Name | Party in Lok Sabha 2019 | Party in Lok Sabha 2014 | Party in Lok Sabha 2009 | State In Lok Sabha 2019 | Constituency In Lok Sabha 2019 | Constituency In Lok Sabha 2014 | Constituency In Lok Sabha 2009 | Assets in Lok Sabha 2019 (Rs.) | Assets in Lok Sabha 2014 (Rs.) | Assets in Lok Sabha 2009 (Rs.) | Asset Increase/ decrease(Rs.) | % Increase/decrease in Asset |
| 1 | Harsimrat Kaur Badal | SAD | SAD | SAD | Punjab | Bathinda | Bathinda | Bathinda | 2,17,99,19,870217 Crore+ | 1,08,16,64,910108 Crore+ | 60,31,00,13560 Crore+ | 1,57,68,19,735157 Crore+ | 261% |
| 2 | Supriya Sadanand Sule | NCP | NCP | NCP | Maharashtra | Baramati | Baramati | Baramati | 1,40,88,88,704140 Crore+ | 1,13,90,90,851113 Crore+ | 51,53,63,66351 Crore+ | 89,35,25,04189 Crore+ | 173% |
| 3 | Pinaki Misra | BJD | BJD | BJD | Odisha | Puri | Puri | Puri | 1,17,47,01,344117 Crore+ | 1,37,09,91,203137 Crore+ | 29,69,00,00029 Crore+ | 87,78,01,34487 Crore+ | 296% |
| 4 | P. C. Mohan | BJP | BJP | BJP | Karnataka | Bangalore Central | Bangalore Central | Bangalore Central | 75,55,29,30675 Crore+ | 47,57,96,99947 Crore+ | 5,37,29,0005 Crore+ | 70,18,00,30670 Crore+ | 1306% |
| 5 | B.Y.Raghavendra | BJP | BJP | BJP | Karnataka | Shimoga | Shimoga : Bye Election on 03-11-2018 | Shimoga | 67,40,93,85167 Crore+ | 58,89,03,79558 Crore+ | 6,62,73,4016 Crore+ | 60,78,20,45060 Crore+ | 917% |
| 6 | Feroze Varun Gandhi | BJP | BJP | BJP | Uttar Pradesh | Pilibhit | Sultanpur | Pilibhit | 60,32,00,53960 Crore+ | 35,73,18,69935 Crore+ | 4,92,67,8104 Crore+ | 55,39,32,72955 Crore+ | 1124% |
| 7 | Jigajinagi Ramesh Chandappa | BJP | BJP | BJP | Karnataka | Bijapur | Bijapur | Bijapur | 50,41,22,98550 Crore+ | 8,94,29,8288 Crore+ | 1,17,53,7251 Crore+ | 49,23,69,26049 Crore+ | 4189% |
| 8 | Badruddin Ajmal | AIUDF | AIUDF | AIUDF | Assam | Dhubri | Dhubri | Dhubri | 78,80,64,04478 Crore+ | 43,27,48,13443 Crore+ | 30,35,20,99130 Crore+ | 48,45,43,05348 Crore+ | 160% |
| 9 | Udasi. S.C. | BJP | BJP | BJP | Karnataka | Haveri | Haveri | Haveri | 71,84,99,19571 Crore+ | 57,66,93,53857 Crore+ | 32,33,61,93532 Crore+ | 39,51,37,26039 Crore+ | 122% |
| 10 | Maneka Sanjay Gandhi | BJP | BJP | BJP | Uttar Pradesh | Sultanpur | Pilibhit | Aonla | 55,69,26,45155 Crore+ | 37,41,32,82637 Crore+ | 17,56,85,97717 Crore+ | 38,12,40,47438 Crore+ | 217% |
Following table showcases the party-wise assortment of the average increase in assets of the re-elected MPs:
| S.No. | Party in Lok Sabha 2019 | Total Number of MPs | Average Assets in Lok Sabha 2019 (in Rs) | Average Assets in Lok Sabha 2014 (in Rs) | Average Assets in Lok Sabha 2009 (in Rs) | Average Asset Increase/decrease (in Rs) | Average % Increase/decrease in Asset |
| 1. | BJP | 43 | 20,01,03,227 20 Crore+ | 13,50,43,248 13 Crore+ | 4,24,00,928 4 Crore+ | 15,77,02,299 15 Crore+ | 372% |
| 2. | INC | 10 | 16,34,77,805 16 Crore+ | 10,63,64,804 10 Crore+ | 5,66,16,457 5 Crore+ | 10,68,61,348 10 Crore+ | 189% |
| 3. | AITC | 7 | 5,90,70,677 5 Crore+ | 3,43,76,226 3 Crore+ | 76,71,088 76 Lacs+ | 5,13,99,589 5 Crore+ | 670% |
| 4. | BJD | 2 | 64,07,98,160 64 Crore+ | 72,99,12,650 72 Crore+ | 17,38,46,915 17 Crore+ | 46,69,51,245 46 Crore+ | 269% |
| 5. | SHS | 2 | 10,65,73,077 10 Crore+ | 4,84,59,593 4 Crore+ | 2,12,26,145 2 Crore+ | 8,53,46,932 8 Crore+ | 402% |
| 6. | AIMIM | 1 | 17,90,44,376 17 Crore+ | 4,06,11,099 4 Crore+ | 93,02,233 93 Lacs+ | 16,97,42,143 16 Crore+ | 1825% |
| 7. | AIUDF | 1 | 78,80,64,044 78 Crore+ | 43,27,48,134 43 Crore+ | 30,35,20,991 30 Crore+ | 48,45,43,053 48 Crore+ | 160% |
| 8. | IUML | 1 | 81,03,274 81 Lacs+ | 1,32,16,259 1 Crore+ | 6,05,855 6 Lacs+ | 74,97,419 74 Lacs+ | 1237% |
| 9. | JD(U) | 1 | 2,92,51,651 2 Crore+ | 1,18,12,717 1 Crore+ | 71,33,058 71 Lacs+ | 2,21,18,593 2 Crore+ | 310% |
| 10. | NCP | 1 | 1,40,88,88,704 140 Crore+ | 1,13,90,90,851 113 Crore+ | 51,53,63,663 51 Crore+ | 89,35,25,041 89 Crore+ | 173% |
| 11. | SAD | 1 | 2,17,99,19,870 217 Crore+ | 1,08,16,64,910 108 Crore+ | 60,31,00,135 60 Crore+ | 1,57,68,19,735 157 Crore+ | 261% |
| 12. | JKNC | 1 | 12,19,04,435 12 Crore+ | 14,18,85,154 14 Crore+ | 9,78,41,140 9 Crore+ | 2,40,63,295 2 Crore+ | 25% |
| GRAND TOTAL | 71 | 23,75,01,836 23 Crore+ | 16,23,79,083 16 Crore+ | 6,15,50,919 6 Crore+ | 17,59,50,917 17 Crore+ | 286% |
Source: Association for Democratic Reforms/National Election Watch

